01 / 04WireScreen2025Lead UX Designer4 months
Addressing the question that was stalling sales — before anyone asked.
WireScreen's data was valuable, but finding hidden relationships — the critical task for government analysts — had a serious bottleneck. Tracing a corporate network meant clicking through profiles, extracting data from tables, and piecing relationships together by hand in outside tools. One of the most common asks in sales demos was "can the platform show me the connections between Company A and Company B?" The answer was no, and that no was slowing sales cycles and costing deals.
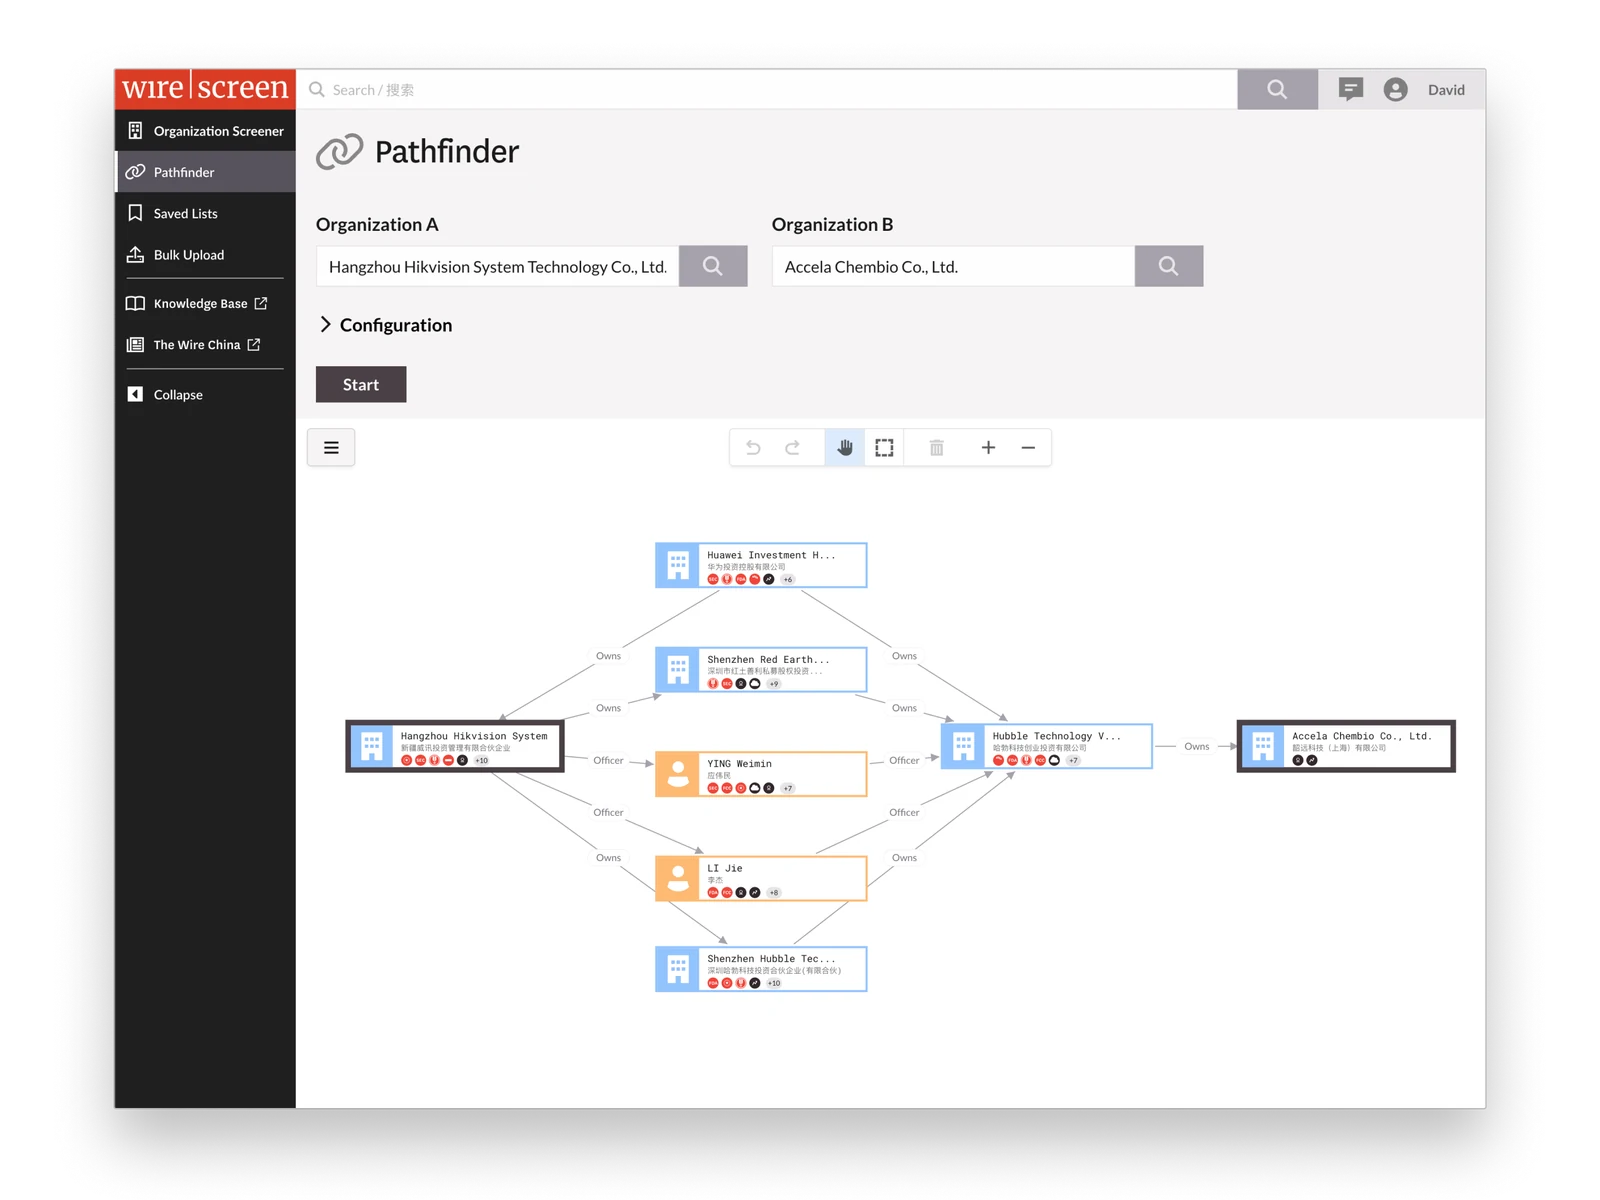
The gap wasn't in the data. It was in the tool's ability to justify the price tag.
The problem
WireScreen had incredibly valuable data, just no easy way to see how it linked companies together.
The cost
WireScreen sells risk intelligence at enterprise prices. Without a connection layer, analysts struggled to show check-writers the value.
The stakes
Seven-figure deals stalled. Sales cycles dragged. Renewals got harder to defend.
How analysts used world-class data to answer "Is Company A connected to Company B?"
- Open Company A's profile.
- Investigate each of Company A's investments.
- Search through the investments of the investments.
- Search through the investments of the investments of the investments.
- Investigate companies with a shared address, phone, website or email.
- Investigate executives, looking for connections between both companies.
- Repeat steps 1–6 for shareholders…
- Repeat steps 1–6 for supply-chain customers…
- Repeat steps 1–6 for suppliers…
- Repeat steps 1–6 for controlled companies without direct ownership…
The data was useful to analysts. The workflow was not.
How do you build with no requirements set in stone?
-
Decision 01
Make connection searching the north star.
Searching for connections between companies wasn't on the roadmap yet, but graphing company networks was. I made graphing Phase 1 and connection searching Phase 2. Every Phase 1 decision — the graphing platform, the rendering model, the feature sequencing — would build toward Phase 2, so that when it was green-lit the foundation was already there.
-
Decision 02
Advocate for the more powerful graphing library.
The team was evaluating lightweight libraries. I pushed for ReGraph, an enterprise-grade library, because of what it could do at scale: a rich component model, flexible APIs, and rendering that would support the complex networks Pathfinder would eventually need to reveal.
-
Decision 03
Reduce graph noise with smart logic.
Entity networks are dense. A single company can have dozens of shareholders, investments, subsidiaries and officers; rendering everything at once creates noise, not insight. I designed a rendering model that flattened bidirectional relationships — cutting the noise while keeping filtering possible. Users didn't have to think about it. It just worked, and it let the platform visualize complex networks without overwhelming anyone.
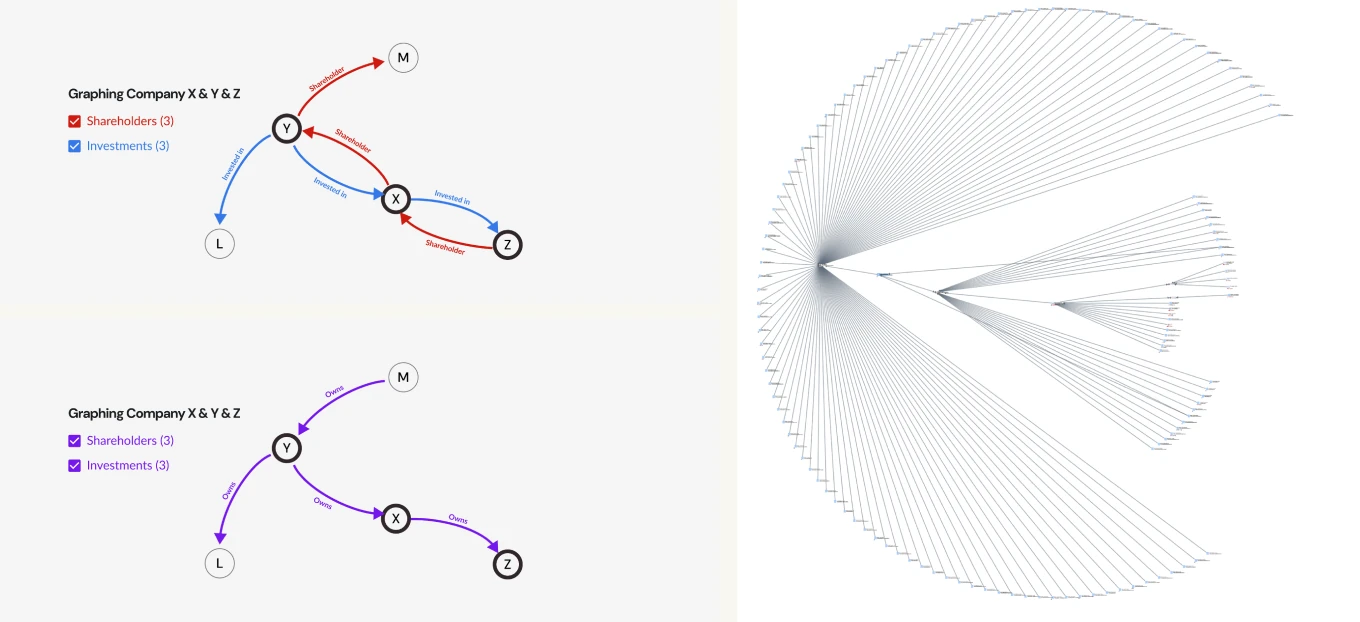
Fig. 02 · Bidirectional relationships, flattened -
Decision 04
Decide what had to ship with v1.
An unfiltered graph would open to visual noise: hundreds of nodes, no way to orient, no clear entry point. Analysts would open it once, decide it didn't work, and never come back. A bad first impression on a feature this visible would be harder to recover from than a delayed launch, and a failed Phase 1 meant Pathfinder never gets approved. Filters shipped with v1. The graph was usable on day one.
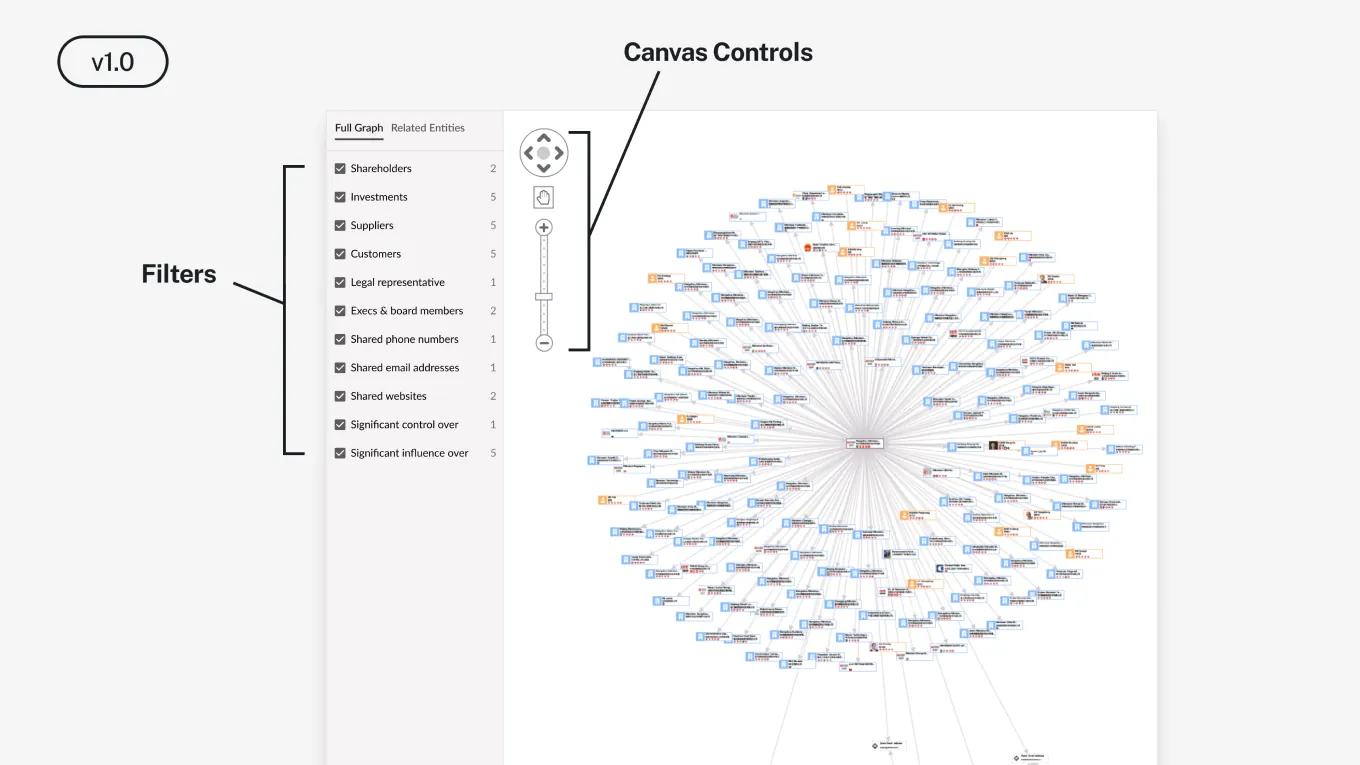
Fig. 03 · v1 — filters and canvas controls from day one -
Decision 05
Sequence the features that follow.
Once analysts were exploring graphs, the next problem was obvious: they needed to show them to someone — coworkers, a procurement committee, a decision-maker. Export as SVG came next: high resolution, small file size, built for the boardroom presentation.
Then, as analysts invested real effort filtering, expanding and repositioning nodes, losing that work on logout stopped being a minor inconvenience and became a reason not to use the feature at all. Save came after.
We didn't just change usage metrics. We changed sales conversations.
Results.
Pathfinder shipped. The answer to "Can I connect Company A to Company B?" became yes. A research process that took days of manual traversal now runs in minutes. In a product sold at six to seven figures, where every contract requires justifying cost to a check-writer, a feature that answers the question killing demos has a direct line to revenue.
Sales credited the platform's new features as the difference-maker in the largest deal in company history.
What took days of manual traversal and research effort now runs in minutes.
High-resolution network exports drop straight into the report, directly shaping decisions.